Distortion measurement of loudspeakers
Every loudspeaker chassis only works optimally in a certain frequency range. If the chassis is operated above or below the optimum range, there is an increase in distortion and distortion increases. Manufacturers usually state the distortion of their loudspeaker chassis, but often such data is not available or you want to check the data yourself. After the limits of the measurement accuracy have been determined by means of a distortion measurement of the sound card, the distortion behavior of a loudspeaker can also be examined and evaluated:
As in the example of the distortion measurement of the sound card, the basis for the distortion measurement is a log sweep with the longest possible duration (120 sec.), as this increases the measurement accuracy. If the distortion of a bass loudspeaker is to be determined, the approach to the lowest frequency in the LogSweep recorder must be delayed (4-5 sec.) In order to guarantee a steady room when the lowest frequency is reached.
Quick guide:
- Create a suitable LogSweep
- Select Logsweep > Logsweep Convolution
- Enter the position of the logsweep measurement file * .wav & Inverse * .dbl
- Mark the center of the pulse
- Run Logsweep > Extract Pulses & Harmonic Distortion
Detailed Instructions:
Two files are required to display the distortion, which Acourate overwrites with each new LogSweep. If LogSweeps are to be created for several measurements, the two required files LogSweepXX.wav and InverseXX.dbl under… Documents \ Acourate \ LogSweep must be copied into a new working directory. In this example, the distortion of a midrange is evaluated, which is used by the manufacturer of the loudspeaker in a frequency range of 400-2400 Hz.
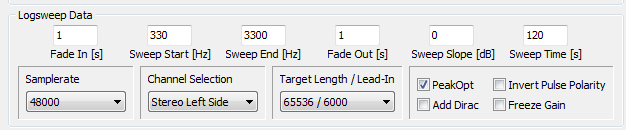
1. First create a LogSweep that covers the frequency range to be examined and is 60 to 120 seconds long.
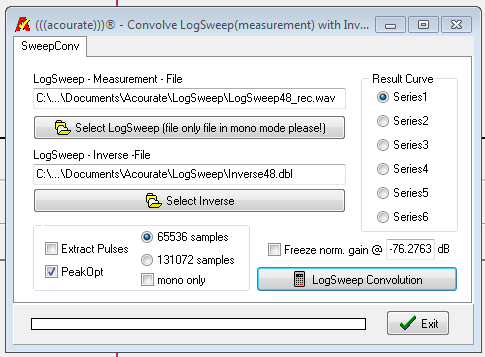
2. Select Logsweep > Logsweep Convolution and enter the position of the two files LogSweep48.wav and Inverse48.dbl. Do not select the Extract Pulses option. Select curve 1 as the destination.
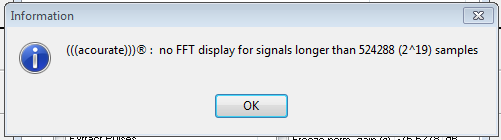
3. Confirm the message that no amplitude can be displayed.

4. Mark the middle of the pulse in the time window with the two mouse buttons..

5.Run Logsweep > Extract Pulses & Harmonic Distortion
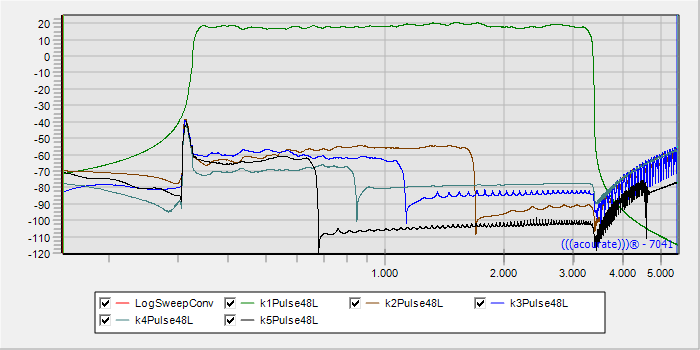
6. The result is now shown: Curve 2 contains the measured pulse response. Curves 3 - 6 contain the distortions from K2 to K5.
If you want to convert the distortion attenuation from dB into distortion factor%, you can use this calculator http://www.sengpielaudio.com/calculator-thd.htm
Interpretation: The greater the distance (signal-to-noise ratio) between the distortions K2-K5 and the measured pulse response, the lower is the distortion.