This is an old revision of the document!
Phase Extraction
Description:
Below the lower limit and above the upper limit specified frequency, the frequency response of the loaded curve is made flat.
Options:
Minimum phase:
Linear phase:
Excess phase:
Advanced mixed phase:
[Can Uli or another signal processing expert write something about a situation where one might use linear or excess phase?]
Use:
A limited band of frequency response can be used for a correction with this function with the frequency response information discarded above or below the selected spectrum (that is, the frequency response output of this funtion is a horizontal straight line below the lower limit and above the higher limit). This function is required, for example to use a near-field recording of frequency response of a speaker driver to linearize digital crossovers. It allows the creation of a correction filter to correct the frequency response of the speaker driver only within a desired frequency band.
Example:
In the following example, a correction filter is desired which corrects only the bass up to about 150Hz. For this purpose Room Macro 1-3 are used to obtain the inverse of the pulse responses from which the correction filters are created. The inverse pulse responses are saved by Room Macro 3 in the working directory under the file name Pulse48Linv.dbl or Pulse48Rinv.dbl. After execution of Macro 3 to delete all curves from the view, load the two inverse curves in curve 1 and curve 2, and zoom in on the relevant frequency range:
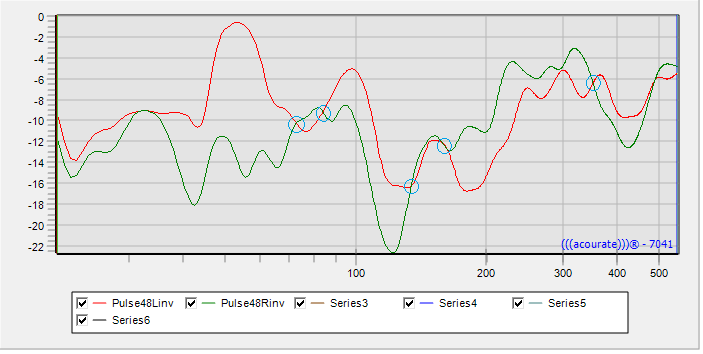
In this case it is important that the uncorrected range of frequencies above approximately 150hz have the same gain applied by the filter, otherwise it will affect the balance of the channels. So for the next step there are two possibilities: either you find an interection of the two curves around 150hz, or you set slightly different high frequency limits for the correction in the two channels in order to get the same gain. What matters is that the two amplitudes are equal at the high limit of correction.

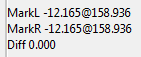
In this example, we have zoomed into the intersection at about 150HZ and clicked the exact point of intersection with the left mouse button. Then you get on the right side of the program window, the frequency at which the mark has been set.

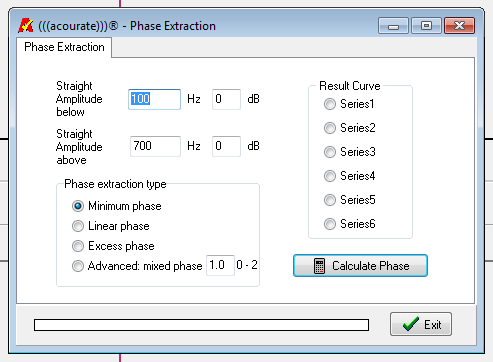
Now activate the curve 1 on the radio button and select TD Functions> Phase Extraction. The frequency response is to be straightened from 159Hz, and the result is loaded into curve 3. Similarly, the result of Phase Extraction of curve 2 is loaded into curve 4.
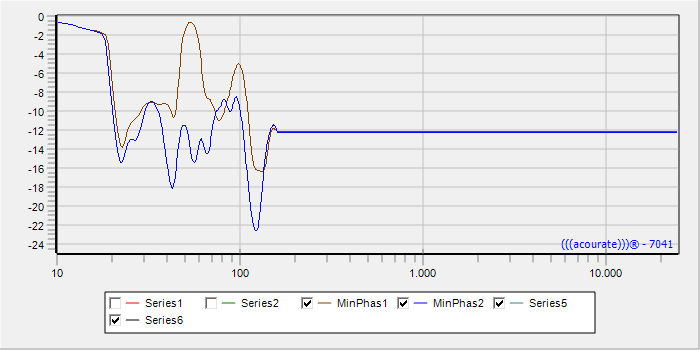
After deleting the original curves you get the following picture. The two new files still must be saved with the name of the old inverse (or Pulse48Linv.dbl Pulse48Rinv.dbl). After that you can create a filter with Room Macro 4.