en:wiki:bedienung:programmoberflaeche
User Interface
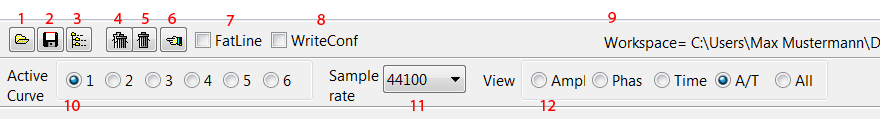
- Open file into Active Curve
- Save Active Curve to file
- Choose or disable Active Workspace (determines default directory for program operations; necessary for proper operation of Room Macros)
- Clear all loaded Curves
- Clear the Active Curve
- Go Back one step
- Make Active Curve thicker
- If WriteConf is checked demand confirmation when saving a curve which will overwrite an existing file
- Displays the current Active Workspace directory path
- Enables selection of the Active Curve for any process steps until another Active Curve is selected. Needed before file open, save, or edit. If a curve number is underlined here, it contains unsaved data
- Sample rate assumed by Acourate for all currently open curves. Must be set BEFORE opening a file. Should not be changed without clearing all curves before further processing
- Charts to View: Amplitude (vs frequency); Phase (vs frequency, including unwrapped phase and group delay); value (usually pressure) (vs Time); Amplitude vs frequency and value vs Time; All three available charts
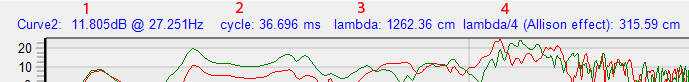
Data for the current cursor position:
- Sound level and frequency
- Time for one full cycle at this frequency
- Wavelength based on speed of sound in dry air at 21.35 degrees Celcius
- 1/4 Wavelength - see Allison Effect in Glossary
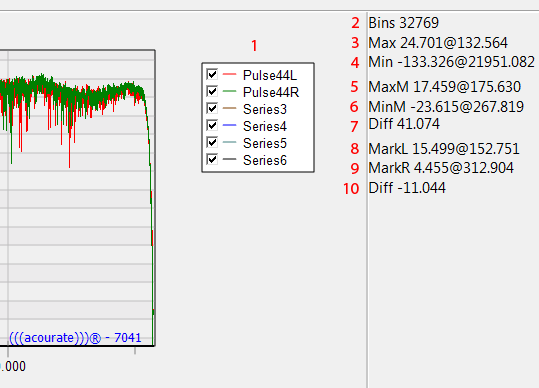
- Filename and illustrated color of the loaded curves (remove checkmark and curve is no longer displayed)
- Number of frequency points of the curve
- Maximum level of the entire curve in dB which occurs at stated frequency
- Minimum level of the entire curve in dB which occurs at stated frequency
- Maximum level within the marked area
- Minimum level within the marked area
- Difference between the two levels
- Level at frequency on the left mark
- Levelat frequency on the right mark
- Difference between the two levels
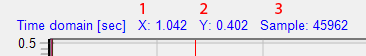
Returns the data from the current cursor position in the time domain.
- X-axis - Time in seconds at cursor position
- Y-axis - value of time signal at cursor position
- Sample - Time in whole samples at cursor position
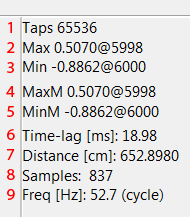
- Number of total samples of a time signal
- Maximum value for samples
- Minimum value in samples
- Maximum value within the marked area
- Minimum value within the marked area
- Total time of the sound signal in the selected interval
- Distance traveled by sound during the selected interval
- Number of samples in the selected interval
- Frequency whose whole cycle time equals the selected interval (1 / cycle time)
en/wiki/bedienung/programmoberflaeche.txt · Last modified: 24/06/2016 15:02 by uli