Amplitude Inversion
Description:
“Reflects” the amplitude response of the selected curve through the 0 dB line, thereby inverting the frequency response variations.
Options:
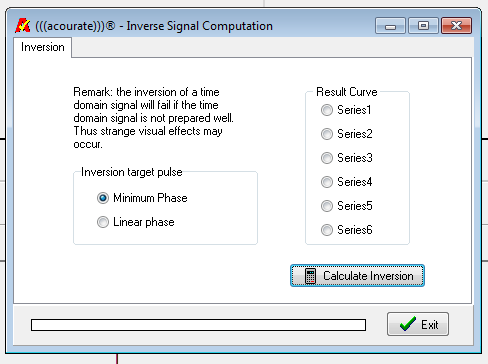
Minimum phase:
Linear Phase:
Use:
To correct the frequency response of an input curve, which may be, e.g., a microphone or speaker driver response curve.
Example:

The green curve represents the inversion of the input red curve, which as you can see is “mirrored” in the 0 dB line to obtain the green curve. Now, if the red curve is convolved with the green curve, the result obtained is a straight line at 0db, a flat frequency response.